Greater Seattle Real Estate Market September 2020- Median Prices Up 19%
Median Prices Way Up Despite Many New Listings
It is getting to be like a broken record, every month there are a ton of new real estate listings, and every month inventory remains low. The Greater Seattle real estate market is part of the NWMLS (Northwest Multiple Listing Service). In the 23 counties that make up the NWMLS this past month’s new listings were up 18.8% from last September. Nevertheless, inventory was down 43% at the end of the month. There were 9,099 active listings at the end of September compared to 15,982 at the same time last year.
The real estate inventory is struggling to keep up with the number of home and condo sales (up 28%) and pending sales (up 23%) in September when compared to last year. In fact, a 3 to 6 month housing inventory is considered to be an even market. Over the entire NWMLS there is less than a month supply (0.89) of inventory. King County is actually one of the few counties with over a month’s supply, but if you take out condos, which sales have not been as fast pace, then King County is at 0.85 month’s of inventory.
Greater Seattle real estate companies, like Ewing and Clark, and Greater Seattle real estate agents tend to agree that low interest rates as well as buyers, who are spending more time at home, are looking for an ideal fit in their homes and condos. Thus buyers are snapping home at record pace. The result is median home and condo prices are up a whopping 19% as compared to last September.
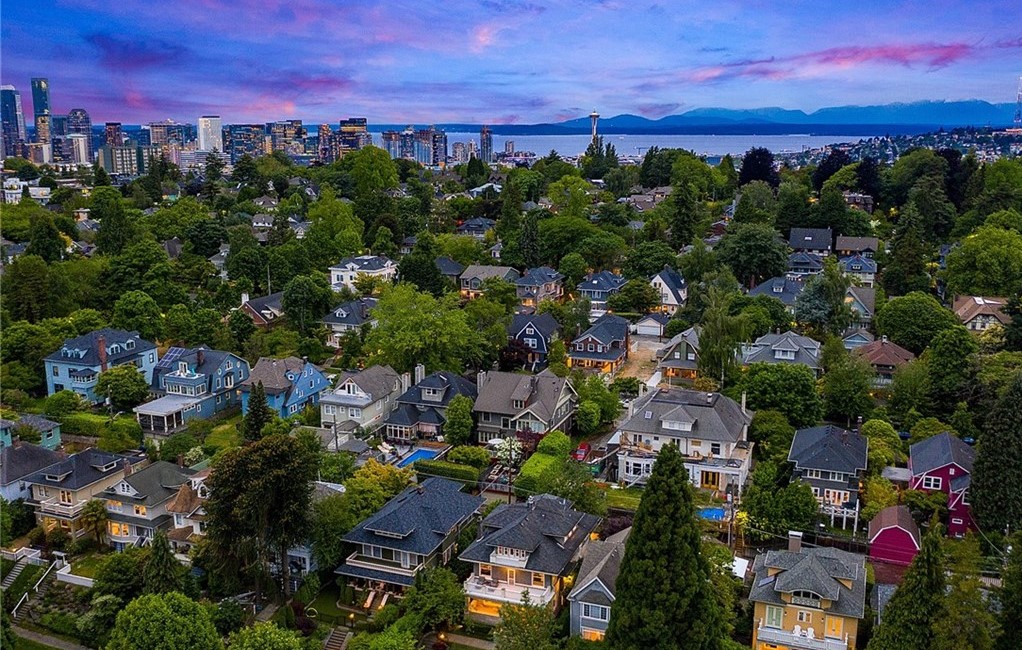
Luxury Real Estate with Ewing and Clark in Capitol Hill Seattle
Is Seattle Real Estate Slowing Down?
Seattle continues to be a desirable place to live despite negative news stories. People are still moving to Seattle. Homes and condos sales are up dramatically: 1,189 closing vs. 750 last year. Despite the increase in Seattle real estate sales, inventory is up 8.4% compared to a year ago, However, this increase is influenced by the 527 Seattle condos recently listed for sale which far outpaces 308 Seattle condos listed last September. Nevertheless, Seattle real estate median price (homes and condos) has increased 11% from $684,500 to $760,000. So while it is true inventory is up, especially when considering Seattle condos, but price are up. So, no, according to the numbers Seattle real estate is not slowing down.
Seattle Homes
All Seattle neighborhoods saw an increase in the number of home sales and the rise in average home sales price. West Seattle has not been slowed down by the closing of the West Seattle Bridge. Both the number of sales and average sales price has increased in West Seattle. The area that includes Capitol Hill, Montlake to Leschi, witnessed an increase in sales and higher prices, even with much of the stories that made national news. The Greater Ballard area continues have the most sales, outpacing last year by nearly 100 real estate transactions and again average neighborhood home prices have increased. The story is the same across Seattle real estate for the home market.
| # of Sales | Avg Sales Price ($) | Avg Sales Price ($) | ||||
| Neighborhoods | Sept ’20 | vs Sept ’19 | Sept ’20 | vs Sept ’19 | YTD 2020 | YTD 2019 |
| West Seattle | 179 | 108 | 753,317 | 710,335 | 748,042 | 712,068 |
| Mt Baker To Rainier Beach | 71 | 45 | 819,313 | 749,547 | 778,407 | 770,475 |
| Montlake to Leschi | 118 | 75 | 1,252,281 | 1,212,369 | 1,215,045 | 1,159,357 |
| Queen Anne to Magnolia | 100 | 61 | 1,315,092 | 1,015,251 | 1,254,013 | 1,197,276 |
| Ballard to Haller Lake | 263 | 164 | 909,004 | 817,656 | 883,332 | 847,343 |
| Laurelhurst to Northgate | 144 | 92 | 1,154,931 | 1,099,273 | 1,017,143 | 950,412 |
The Seattle home market was not only consistent across Seattle neighborhoods but also across price points. The Seattle homes under $600,000 are selling on average for over asking price and in 26 days compared to under asking and 42 days last September. Seattle luxury real estate, homes that sold for over $2 million, have over doubled! This past month, 54 Seattle luxury homes sold while only 20 sold last September.

Stunning Luxury West Seattle Home Available for Purchase
Seattle Condos
As indicated above, Seattle condos are not as hot as Seattle homes, but there were a ton of condo sales in September as compared to last year. Nevertheless, condo inventory did increase with 527 Seattle condos recently listed for sale which far outdistanced 308 Seattle condos listed last September. The new condo listings also far outnumbered the sales in September. So while condo prices increased in all Seattle neighborhoods in September, the prices for 2020 are not consistently up across all areas like Seattle homes are.
| # of Sales | Avg Sales Price ($) | Avg Sales Price ($) | ||||
| Neighborhoods | Sept ’20 | vs Sept ’19 | Sept ’20 | vs Sept ’19 | YTD 2020 | YTD 2019 |
| West Seattle | 26 | 18 | 591,461 | 500,272 | 517,139 | 494,937 |
| Mt Baker To Rainier Beach | 2 | 4 | 373,000 | 340,250 | 377,948 | 340,798 |
| Montlake to Leschi | 50 | 51 | 628,657 | 468,682 | 575,248 | 536,957 |
| Queen Anne to Magnolia | 46 | 32 | 614,342 | 498,949 | 582,346 | 585,846 |
| Belltown | 41 | 38 | 796,776 | 648,635 | 808,616 | 851,493 |
| Ballard to Haller Lake | 60 | 21 | 468,204 | 425,849 | 461,256 | 444,412 |
| Laurelhurst to Northgate | 28 | 18 | 441,952 | 433,916 | 429,377 | 404,298 |

Luxury Seattle Real Estate with Ewing and Clark provide listings with beautiful Seattle waterfront and skyline views.
Seattle Condo Available for Purchase.
Seattle Real Estate Questions? Contact Us!
To learn more about the Greater Seattle real estate market, feel free to reach out to Ewing and Clark. We have been providing the Seattle region real estate service since 1900. In addition, for more information on other local areas, look for our market reports on our real estate blog. For example, we recently published our Mercer Island real estate report as well as Seattle neighborhood market reports on our sister websites: Broadmoor and Capitol Hill.