July Real Estate Report – Seattle, Bellevue, Mercer Island
Northwest Real Estate Market is Historically Tight
You cannot look at the Bellevue, Mercer Island, Seattle real estate market without looking at the overall market first. Despite more real estate listings coming on the market, home inventory remains historically tight. The Northwest Multiple Listing Service (NWMLS) includes 23 counties in Washington State. The number of new listings in month of July was up 11.8% from last year, but the number of pending sales were up and in July had the most closed sales since June 2018. Thus, despite in the influx of new listings, inventory remains very low. At the end of July, there was only 1.04 months worth of inventory which is a 10 year low. While this is good news for sellers, buyers are enjoying low interest rates. One would need to talk to their local lender for current rates, but 30 year fixed rates are very attractive at this time.
It should be noted while King County still has the highest median sales price ($670,000) and has low inventory 1.13 month supply vs last year’s supply of 1.75, but the surrounding Puget Sound Counties have extremely low inventory: Snohomish (0.73), Pierce (0.84), Kitsap (0.84), and Island (0.89).
Seattle Real Estate: Prices Still Up
Seattle Real Estate – Homes Keep Selling for More

Ballard Home (above) listed by Jane Powers
Seattle saw an increase in the number of Seattle home sales with an increase in median sales price. As seen in the Seattle real estate chart below, all listed areas saw an increase in number of sales while only Mt Baker to Rainier Beach saw a decrease in median sales price. Moreover, all Seattle neighborhood areas have seen an increase in median sales price as compared to last year. Queen Anne and Magnolia homes are the only combined Seattle neighborhoods that have a median sales price of over $1 million, but Montlake, Capitol Hill, Madison Park, Broadmoor, Madrona and Leschi combine to be nearing that milestone. On the other hand, Southeast and Southwest Seattle continue to be the most affordable neighborhoods for the Seattle real estate market.
| # of Sales | Median Sales Price ($) | Median Sales Price ($) | ||||
| Neighborhoods | July 2020 | vs July 2019 | July 2020 | vs July 2019 | YTD 2020 | YTD 2019 |
| West Seattle | 168 | 166 | 670,000 | 648,000 | 671,000 | 650,000 |
| Mt Baker To Rainier Beach | 79 | 69 | 699,950 | 710,000 | 669,945 | 630,000 |
| Montlake to Leschi | 97 | 79 | 980,000 | 925,000 | 934,999 | 929,500 |
| Queen Anne to Magnolia | 87 | 76 | 1,050,000 | 950,000 | 1,095,778 | 1,007,500 |
| Ballard to Haller Lake | 245 | 198 | 806,000 | 759,950 | 785,500 | 780,000 |
| Laurelhurst to Northgate | 139 | 123 | 900,000 | 800,000 | 847,000 | 816,250 |
Seattle Condo Market
Seattle condo sales had similar number of sales when compared to last July. However, average prices in Seattle condo prices varied by Seattle neighborhood. In contrast, median sales price did increase year-over-year for King County. For instance, in King County, there were 656 closings in July vs 645 closings last July. Furthermore, median prices for condos’ rose in King County to $430,000 vs $400,000 last year, but as stated before, depending on the Seattle neighborhoods the condo prices fluctuated.

First Hill Condo (above) listed by Marie Dennis.
In the Seattle real estate market, fluctuation in condo prices can very greatly based on various factors, but especially based on the size of condos. For example, the 20 condos sold in West Seattle sold for a median sales price of $535,000 this July vs $377,500 last year. On the other hand, it is interesting to note that West Seattle median sales price for the year is exactly the same as last year $440,000. Therefore, this suggests the price differential in July for West Seattle condos had to do more with the differences in the condos sold vs the overall market. Certainly when looking more closely at the numbers this is confirmed with 2020 West Seattle condos selling for $519/sq ft versus $426/sq ft in 2019.
Following are the summary numbers for the Seattle condo market:
| # of Sales | Median Sales Price ($) | Median Sales Price ($) | ||||
| Neighborhoods | July 2020 | vs July 2019 | July 2020 | vs July 2019 | YTD 2020 | YTD 2019 |
| West Seattle | 20 | 20 | 535,000 | 377,500 | 440,000 | 440,000 |
| Mt Baker To Rainier Beach | 3 | 3 | 312,000 | 300,000 | 369,900 | 332,000 |
| Montlake to Leschi | 61 | 61 | 480,000 | 449,950 | 477,475 | 475,000 |
| Queen Anne to Magnolia | 47 | 37 | 479,900 | 575,000 | 477,450 | 495,000 |
| Belltown | 50 | 46 | 681,750 | 649,000 | 675,410 | 650,000 |
| Ballard to Haller Lake | 36 | 45 | 398,475 | 414,950 | 419,000 | 417,500 |
| Laurelhurst to Northgate | 15 | 27 | 403,000 | 385,000 | 390,000 | 380,000 |
Bellevue Real Estate
For real estate brokers, Bellevue is divide into two main areas: West of 405 and East of 405. West Bellevue includes such cities as Clyde Hill, Medina, and Hunts Point while East Bellevue includes Crossroads and the west side of Lake Sammamish.
Bellevue Home Sales
There were 27 home sales in West Bellevue in July vs 32 last July. In contrast, the average sales price was $3.285 million that was up from last July ($2.581 million). Year-to-date, both the number of West Bellevue homes sales and the average Bellevue home price is down. For example, 149 home closings vs 209 last year at this time, and average sales’ price is $3.036 million vs just under $3..060 million last year. In short, even with prices down slightly, West Bellevue is surely a luxury real estate market.
Conversely in East Bellevue there were 83 home sales versus 69 last July with average sales price nearly $1.3 million compared to $1.137 million last July. Still the number of sales are down for the year although prices are up. There have been 332 sales this year (417 last year at this time) with average just above $1.196 million compared to just over $1.098 million last year.
Bellevue Condos
In West Bellevue there were 19 Bellevue condo sales in July compared to 16 last year. Average sales price was just over $831,000 when last year the average sales price was just over $1 million. Year-to-date Bellevue condo closings are only 118 transactions (146 same time last year), but average price has increased to $910,000 versus just over $874,000 last year.
In East Bellevue there were 36 Bellevue condo sales compared to 32 last year. In addition, the average sales price was just over $544,000 when last year the average sales price was just over $510,000. Meanwhile, year-to-date Bellevue condo closings are only 171 transactions (252 same time last year), and average price remains nearly identical $548,802 in 2020 compared to $548,252 in 2019.
Mercer Island Real Estate
Mercer Island Home (above) listed by Rob Potashnick.
In July there were 39 Mercer Island home sales compared to 24 last July. Moreover, average Mercer Island home sales price was over $2.026 million vs $1.978 million the previous July. However, for the year there have 158 Mercer Island home sales for an average of $1.888 million compared to 181 sales for an average of $1.983 million the previous year.
For 2020, there have been 29 Mercer Island condo sales for an average of $618,711. In contrast, during the same time period in 2019, there were 19 sales for an average of $633,286.
Need More Info on Bellevue, Mercer Island, and Seattle Real Estate
In conclusion, a blog cannot cover all the nuances of the Seattle real estate market, the Bellevue condo market, or the Mercer Island home market. Therefore, if you need more information on the real estate market in any of these areas or others, whether residential or condo market, then please reach out to a residential real estate broker.
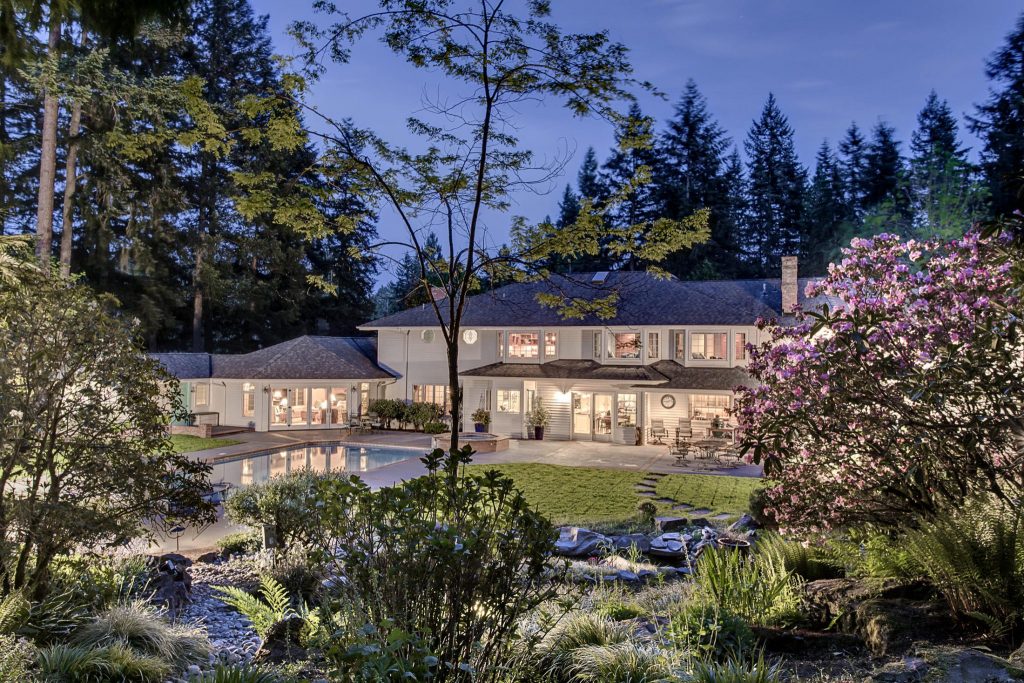
Ewing & Clark covers many areas, including the east side of Lake Sammamish. Below this 6 acre Sammamish estate is listed by Kristine Losh of Ewing & Clark.